Sample Storyboard
With JAMSTACK analytics there is no need to stick to the traditional dashboard layouts. It is possible to mix text, images and other supporting media along with tabular data and charts providing compelling data narratives. Infact, this is an example of a data storyboard.
Below are the list of earthquakes in the last one month.
Loading...
One advantage of using page scope for the loaded data is that each time the page is visited the latest data is loaded.
Number of earthquakes by type
Below is the number of earthquakes by type.
The second most common type of quakes after the natural earthquakes are the quarry blasts.
Loading...
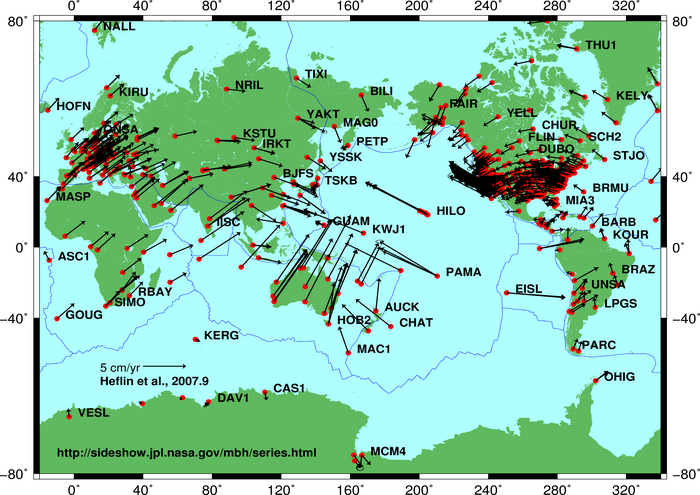
Global Plate Motion
It is possible to embed images and other media to tell a compelling story.